
An XRD pattern is a plot of diffracted intensity against the diffraction angle 2θ, and what it records is scattering from the crystal lattice. A periodic arrangement of atoms gives peaks; how sharp those peaks are depends on how far the arrangement stays coherent. Read a size off the peak width and you have measured the ordered region that diffracts coherently along one particular crystallographic direction — nothing else.
The electron microscopes answer a different question. A conventional SEM secondary-electron image shows surface topography; a TEM image is built from transmitted and scattered electrons. Measure a diameter across the particle outline in either one and you have a geometric dimension of that outline. A single TEM image also folds the thickness of the specimen into one flat projection.
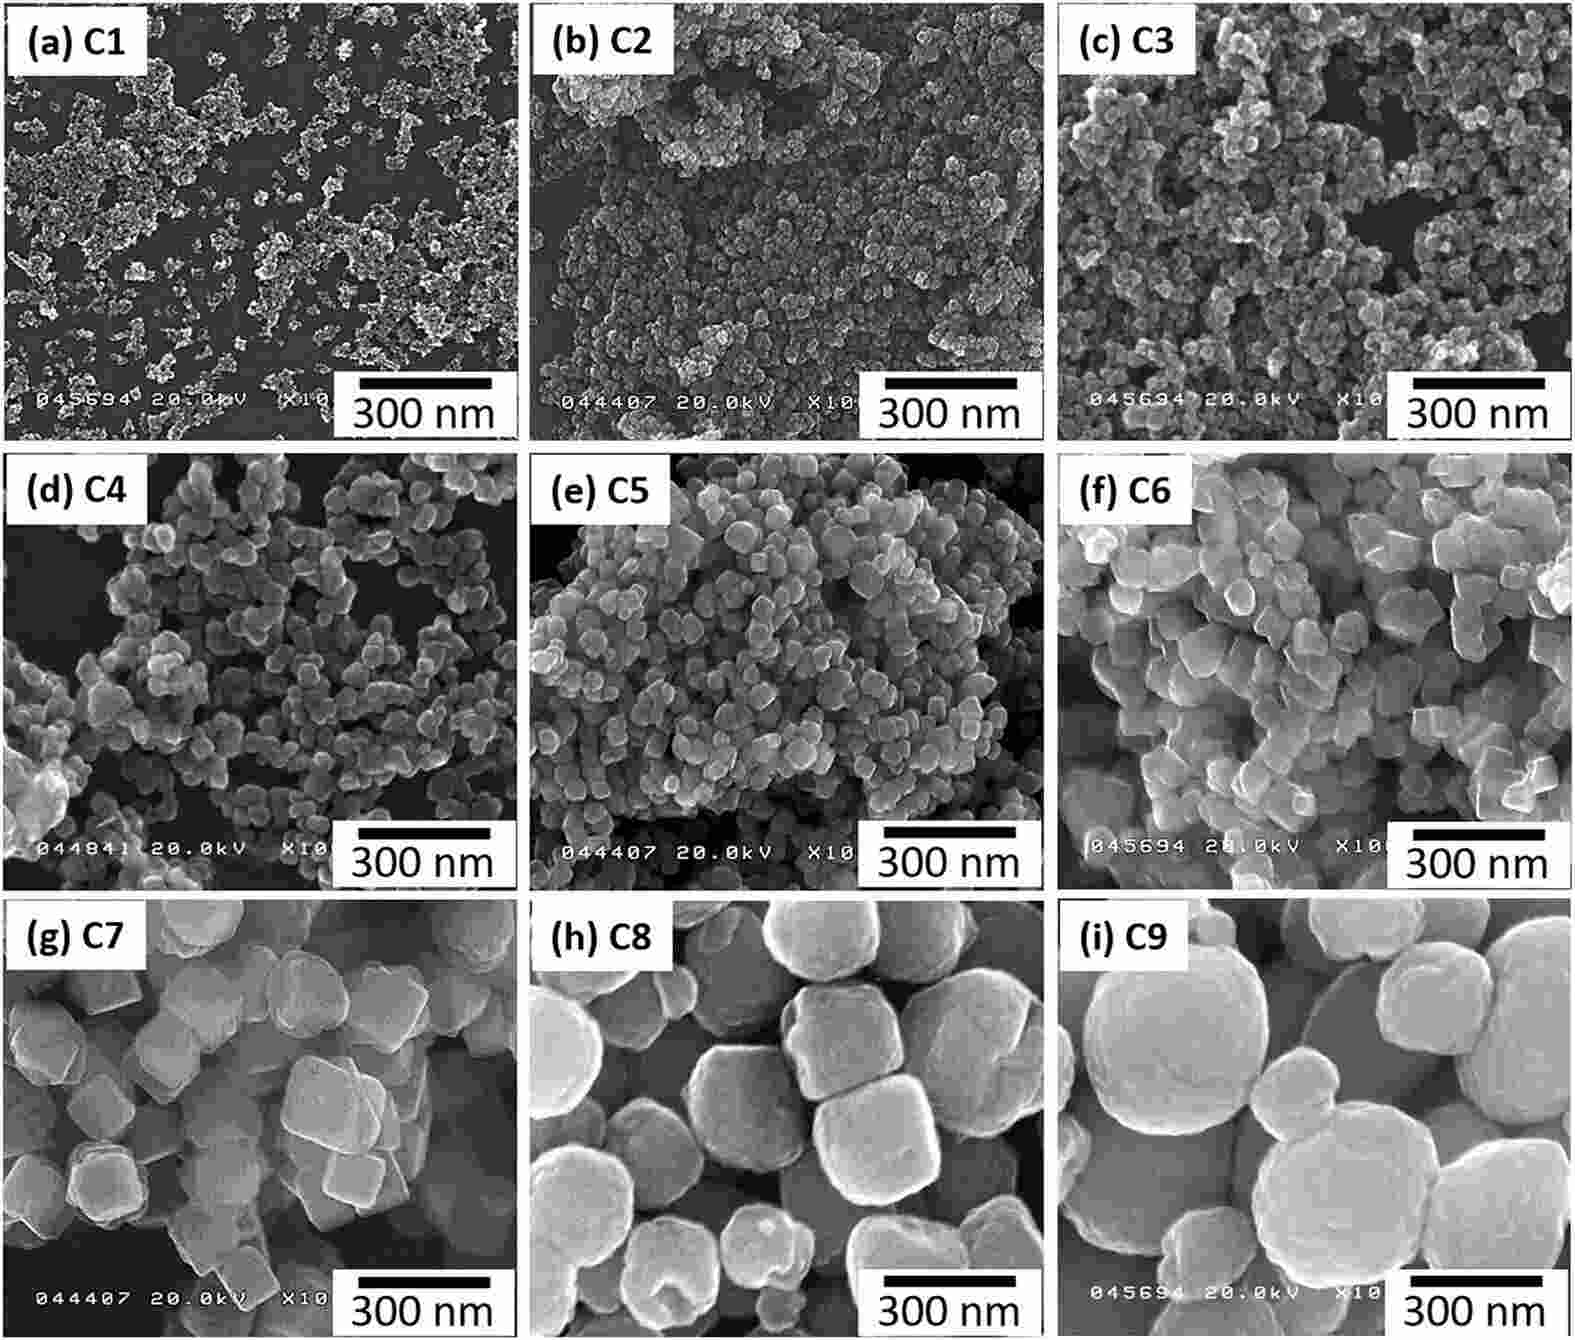
Figure 1. SEM morphology of near-cubic Fe3O4 nanoparticles at different particle sizes.
Inside that outline there may be one grain, or a dozen grains pointing in different directions. Particles are sorted by shape, grains by orientation and grain boundaries, and coherent domains by the coherence range of whichever reflection is being analysed. Defects can shorten the coherence length inside a grain until it is smaller than the grain itself.
The standard bridge from coherence length to peak width is the Scherrer equation, D = Kλ / (βsize cos θ): λ the wavelength, θ half the diffraction angle, βsize the size broadening of the 2θ peak in radians, and K a dimensionless factor set by the particle shape and by how the breadth is defined. Only the size term belongs in this equation, and FWHM and integral breadth each need their own K.
Because D refers only to the coherent region, a particle built from many grains can report a D far below its measured diameter. Palladium nanodiscs make the point: about 200 nm across, roughly 30 nm thick, with an initial mean grain size of 10 ± 2 nm. Both external dimensions exceed the grains inside, and hydrogen absorption–desorption cycling coarsens those grains further.
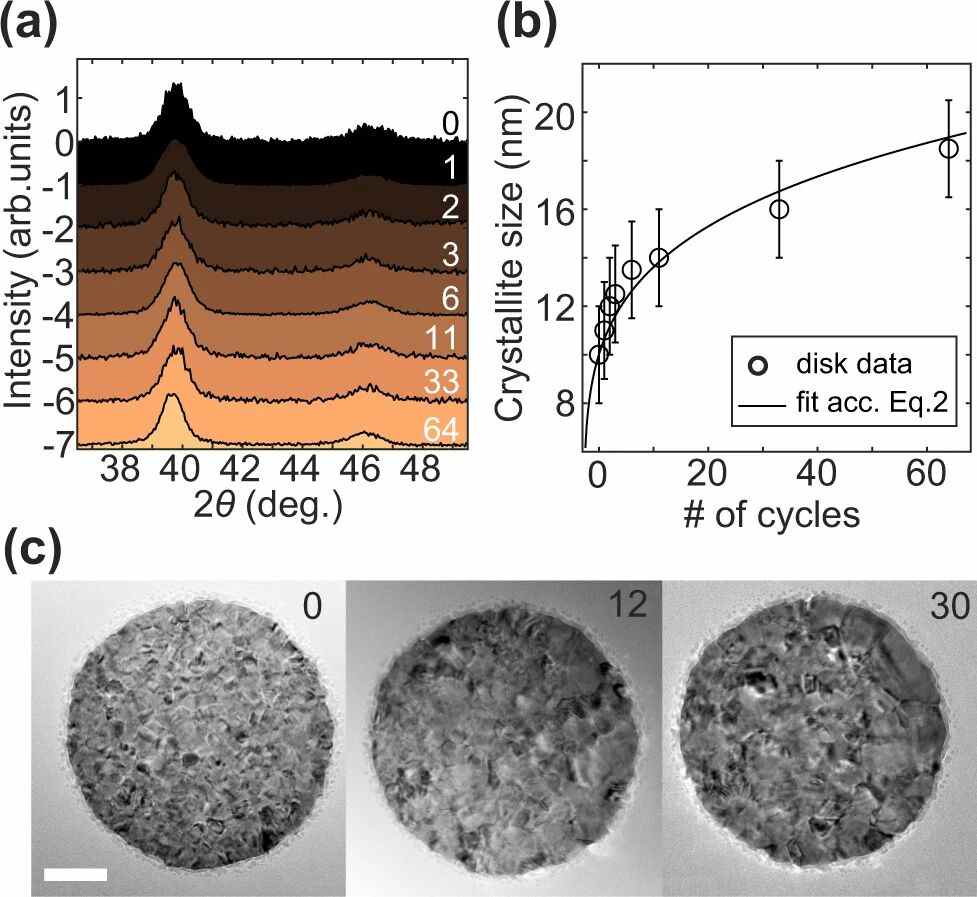
Figure 2. Grazing-incidence XRD, mean domain size and TEM sequences of the same palladium nanodiscs across hydrogen absorption and desorption cycles.
Aggregation produces the same gap from the outside. When nanocrystals of mixed orientation gather into a larger body without a continuous coherent lattice running through it, SEM measures the body while XRD measures the domains. High-resolution TEM and local electron diffraction recover the internal orientation and the interfaces; an ordinary SEM image cannot see grain boundaries buried inside the outline.
Even an isolated particle can be larger than its crystal. An amorphous shell has no long-range order and scatters diffusely; the crystalline core delivers the Bragg peaks. Measure the whole particle and the shell is included; estimate the coherence length from a core reflection and only the crystal is described.
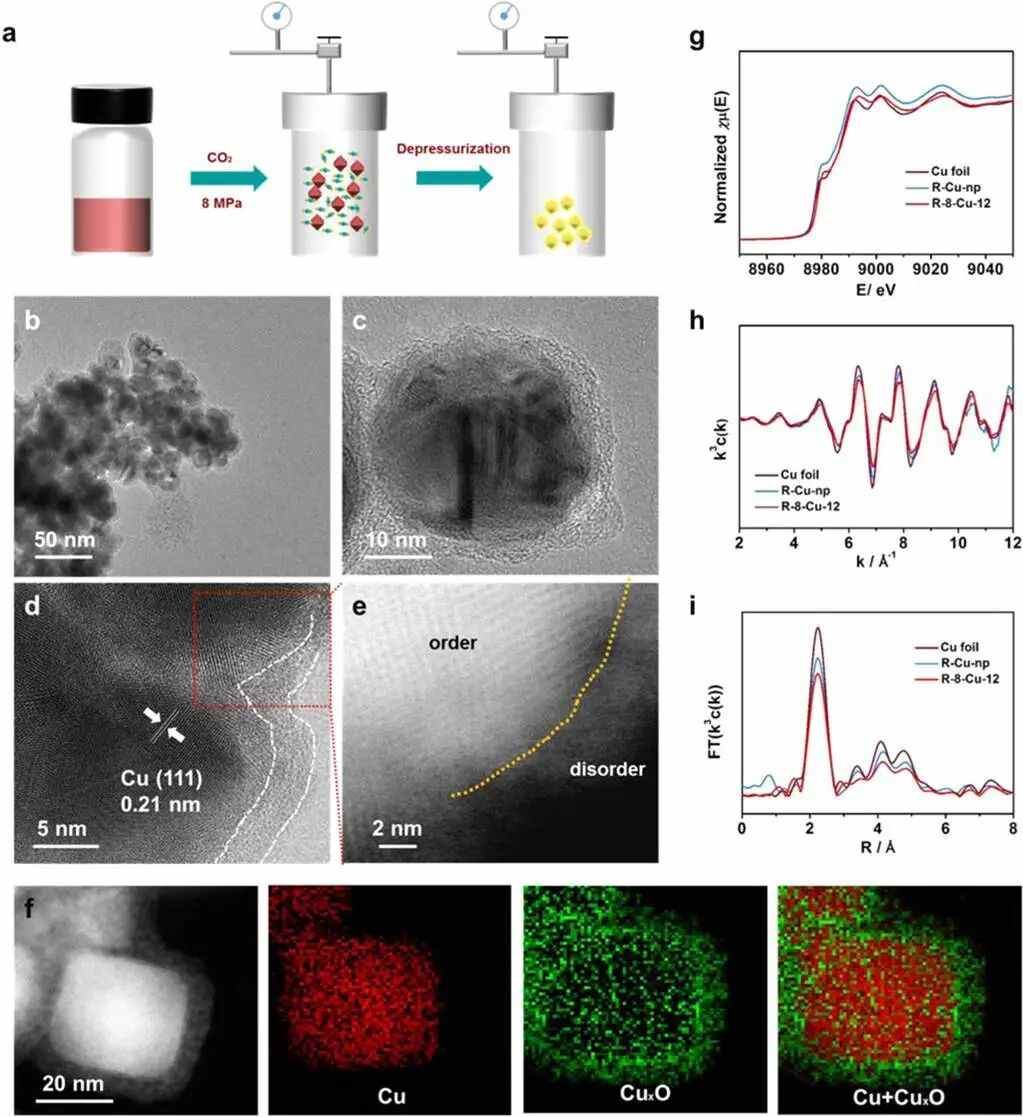
Figure 3. Preparation of copper-based particles, the crystalline-core/amorphous-shell structure and its valence distribution, and the copper K-edge absorption spectrum after reduction.
Copper nanoparticles held in 8 MPa of CO2 for 12 h show the split cleanly: the overall size was still about 40 nm, but the outer 4 nm had turned into amorphous CuxO. That shell is the amorphous copper oxide present before electroreduction, with crystalline copper still inside. The outline includes the shell; the copper reflections come from the core.
The core's own peaks are broadened by microstrain as well. Interplanar spacings vary slightly from point to point, so the angles that satisfy the Bragg condition spread out. Charge that width to size broadening and β comes out too large, which drives D down. Fix K, λ and θ, overstate β by 20%, and D falls by about 17% — because 1 / 1.2 is 0.83.
Instrumental broadening adds to it, and its angular dependence can be pinned down with a standard run under identical optics. Instrument and specimen profiles convolve, and there is no general way to subtract one FWHM from another. Once the instrument response is removed, the angular dependence across several reflections supports Williamson–Hall and similar analyses, which separate size from microstrain.
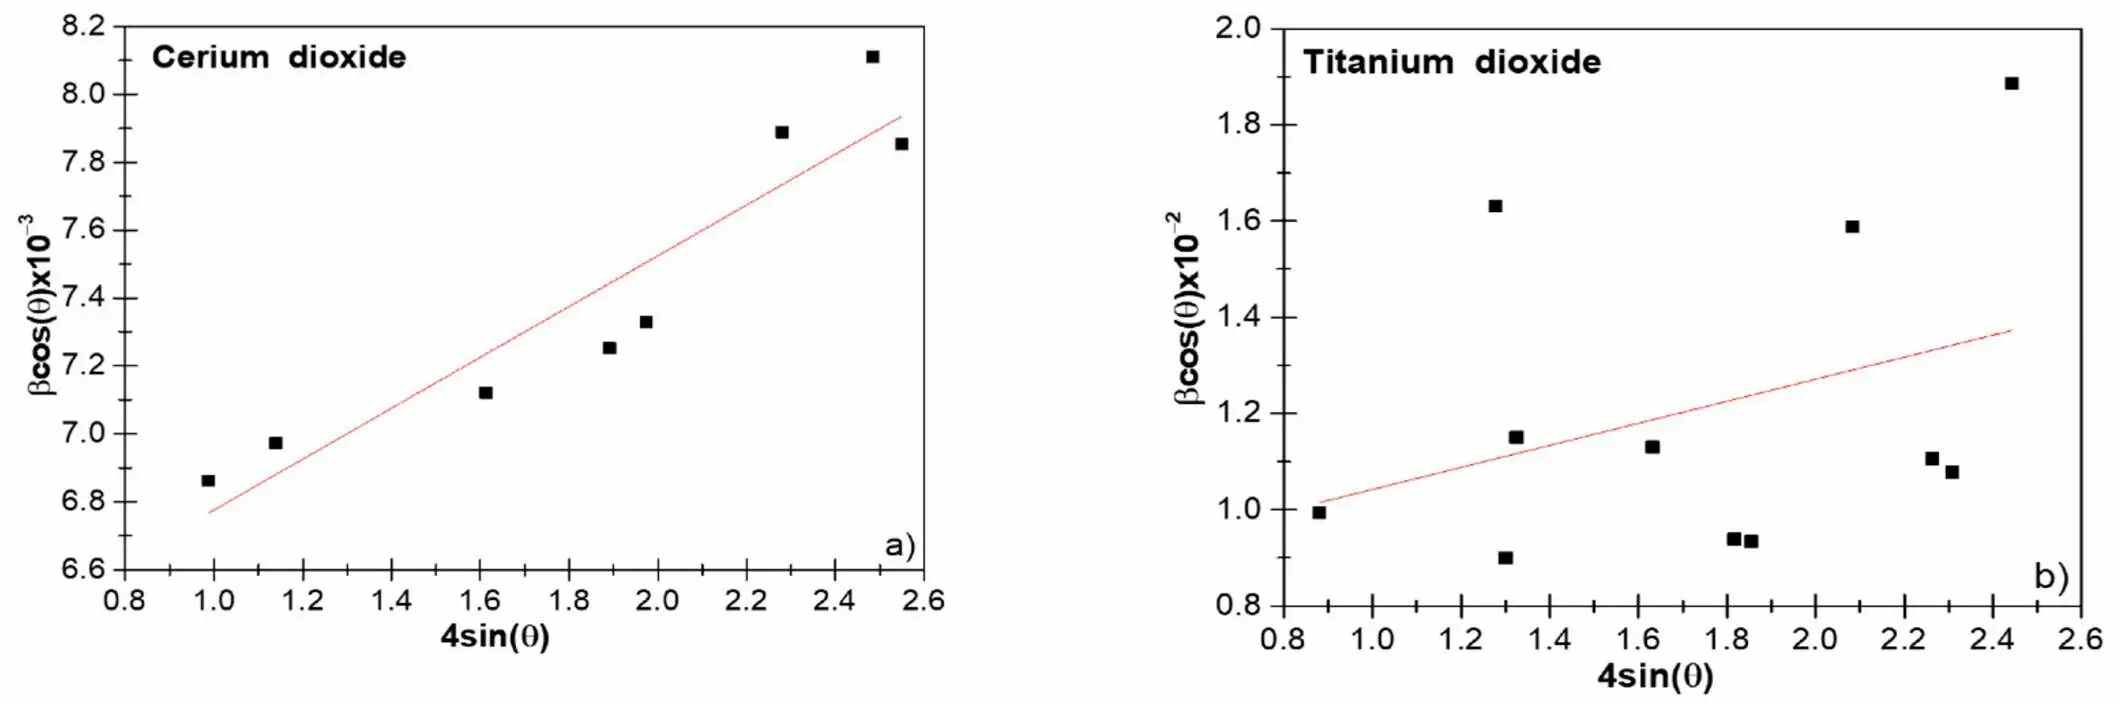
Figure 4. Williamson–Hall analysis of CeO2 and TiO2 nanoparticles.
The simplified Williamson–Hall treatment assumes that size and microstrain are much the same in every direction, and its peak-shape model has to fit the data.
In the CeO2/TiO2 comparison, the multi-peak data for TiO2 fell away from the straight line: dislocations, stacking faults and direction-dependent size each disturb individual reflections. And where the measured peak already sits close to the instrument line width, almost no size broadening is left, so a small difference in the fit moves D a long way.
Correct the instrument response and direction still matters. A single reflection reports the coherence length along its own plane normal; a micrograph reports a projected diameter, often the longest one, or an equivalent diameter. Rods and plates differ in length, width and thickness by large factors, so numbers taken from different directions can disagree several-fold.
LDH sheets carry a lateral dimension and a thickness at once. One study took sheet shape and height from AFM and the in-plane domain size from the (110) reflection, then followed both against the shear rate used in synthesis. The in-plane coherence length tracks the lateral morphology of the sheet; it is not a thickness.
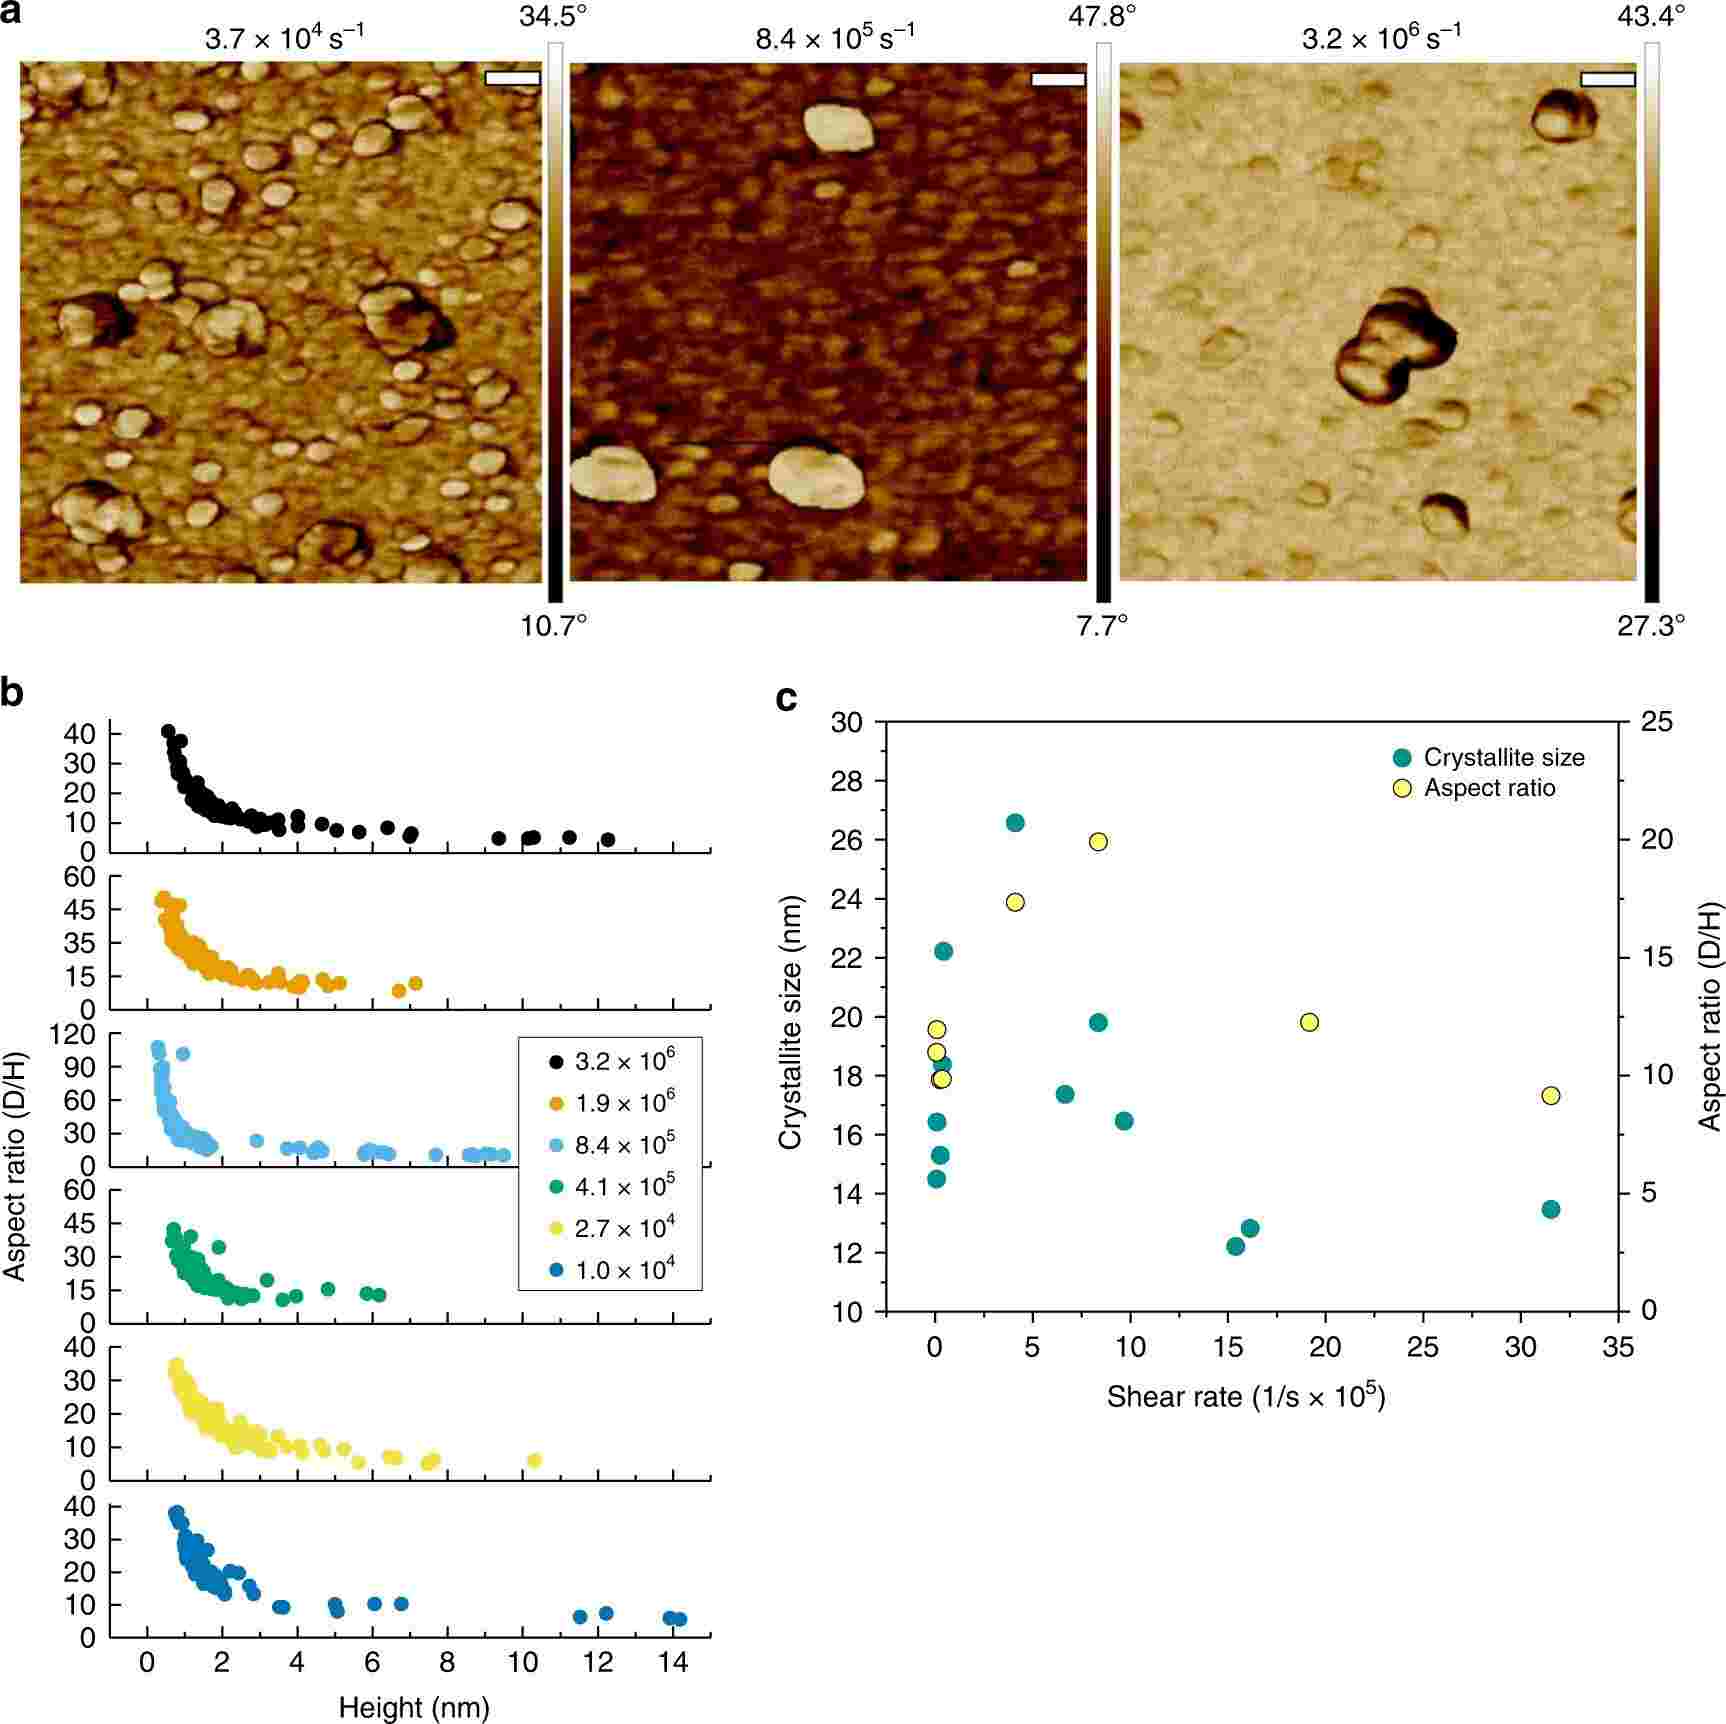
Figure 5. AFM morphology, aspect ratio and in-plane domain size of LDH sheets synthesized at different shear rates.
For a layered crystal whose basal plane lies close to perpendicular to c, the (00l) reflections along c report coherence in the stacking direction. Lay a thin sheet flat and the TEM projection instead emphasises the much larger lateral outline, so the two numbers can sit far apart even when the sheet is well crystallized throughout. The coherence length approaches the particle dimension in a given direction only when the lattice stays ordered up to the outline along that direction.
Measuring particle after particle on TEM images and averaging gives a number-weighted mean. XRD reaches its size through diffracted intensity and a profile model, so the answer moves with the definition of breadth, the shape assumed and the distribution assumed. The CeO2/TiO2 study set model domain-size distributions beside TEM particle-size distributions; the two are not the same kind of histogram.
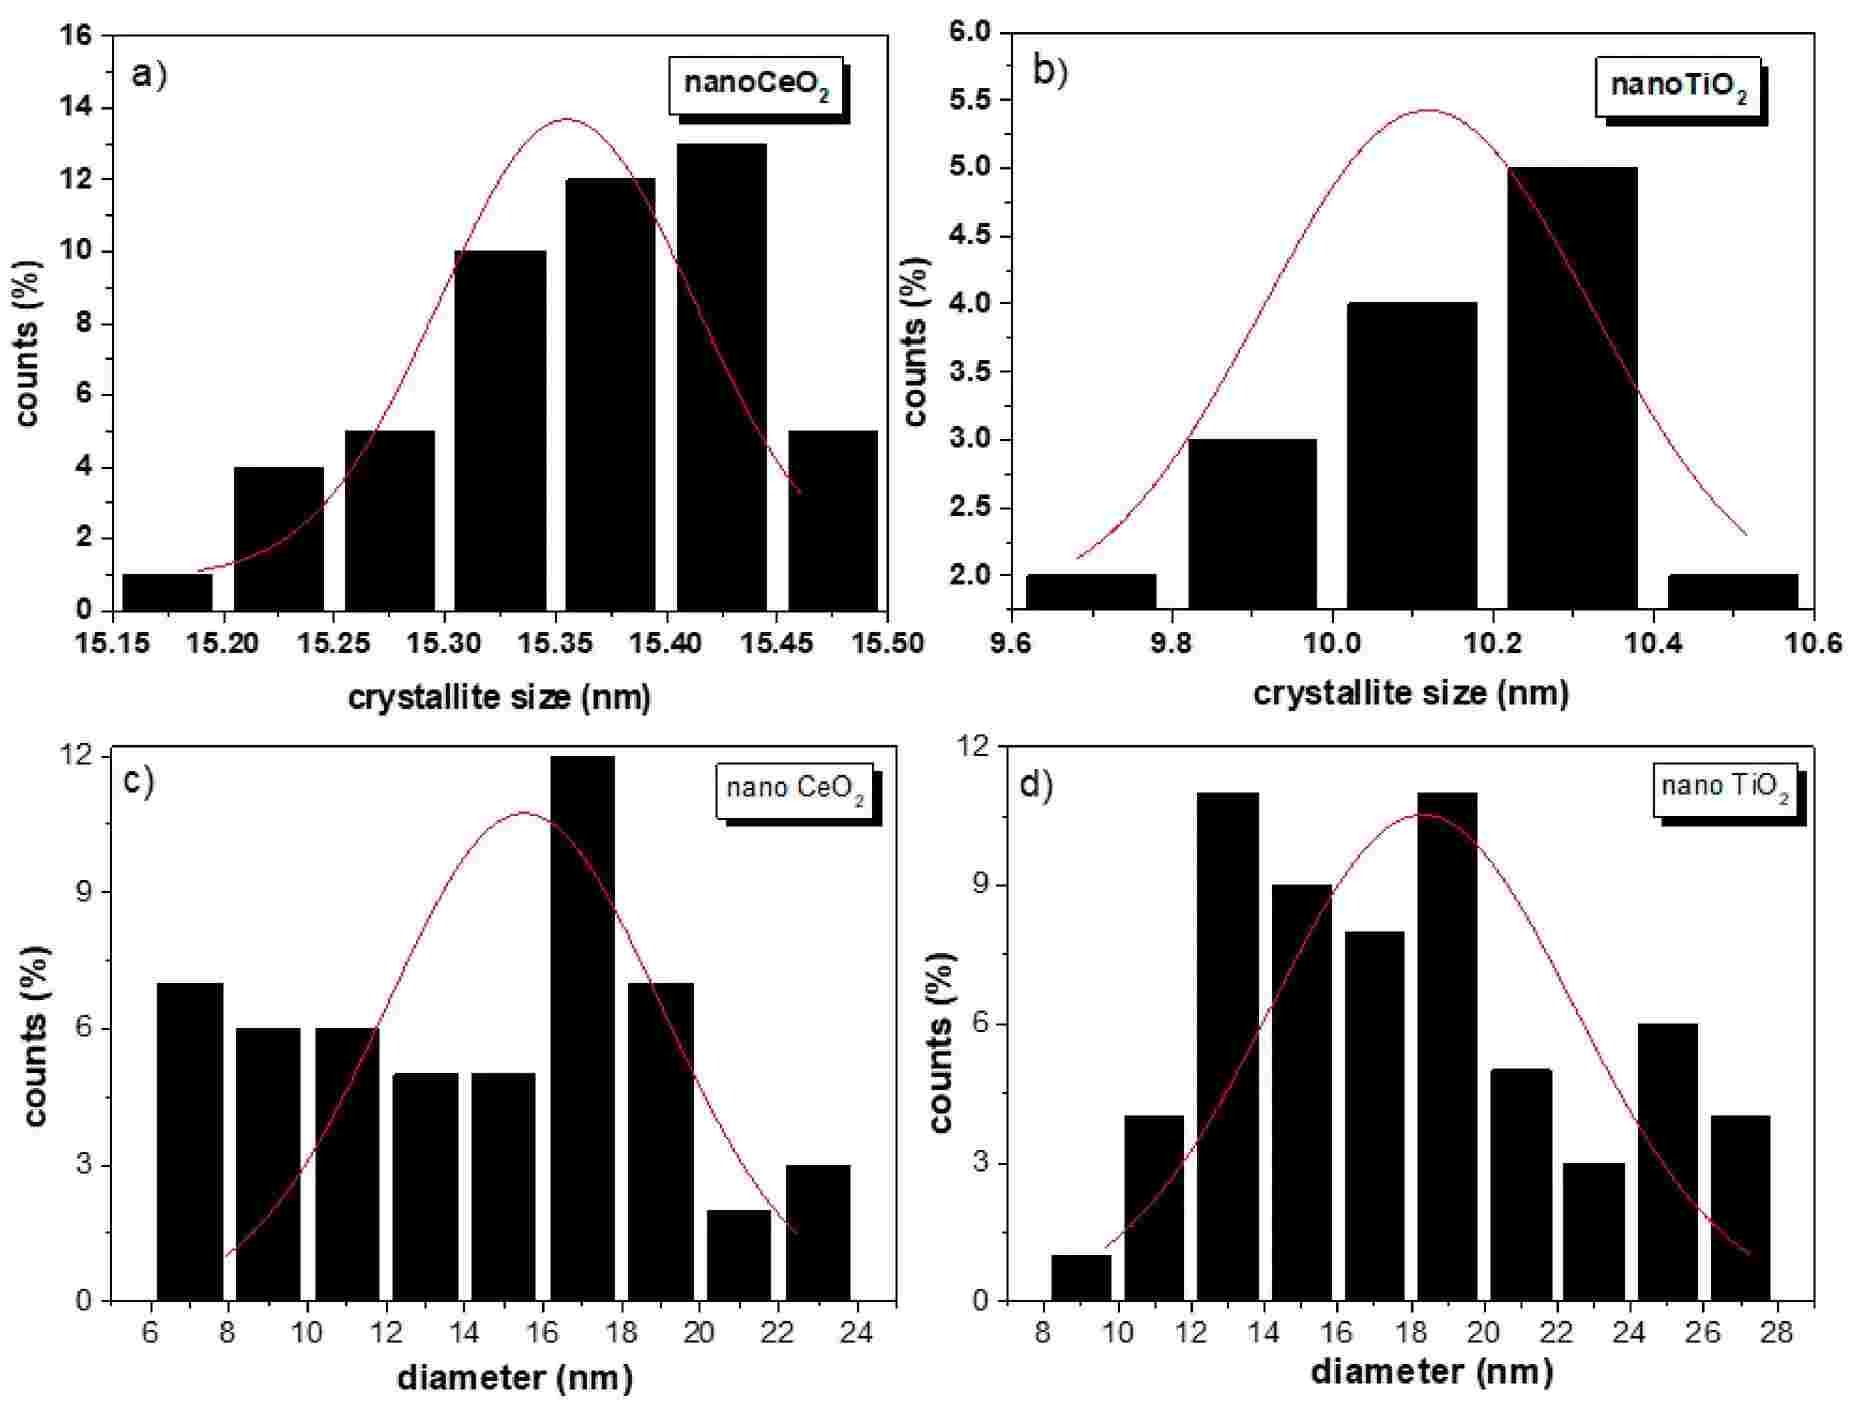
Figure 6. Model domain-size distributions of CeO2 and TiO2 alongside TEM particle-size distributions.
A broad distribution divides the work between the two ends: a few large crystals supply the narrow part of the profile, the small ones the broad part. If the micrograph happens to favour small, well-dispersed particles with clean outlines, its mean is pulled low. XRD can therefore come out larger than the microscopy mean as well, and which number is bigger depends on the sample, the sampling and the profile model.
The two agree only under favourable conditions: representative sampling, near-equiaxed single crystals and a narrow distribution. In one set of near-cubic Fe3O4 particles spanning roughly 10–65 nm, XRD domain sizes came close to TEM particle sizes, and high-resolution TEM showed lattice fringes running in the same direction throughout each particle.