
Analysis of specific surface area and porosity
The specific surface area and porosity have a significant impact on the performance of catalysts. A larger specific surface area means more active sites are exposed, allowing reactants to more fully contact the catalyst, thereby increasing the reaction rate. The appropriate pore structure facilitates the diffusion of reactants and products, affecting the selectivity of the reaction.
1.BET specific surface area test method
BET analysis is a commonly used method for measuring the specific surface area and porosity of catalysts. It is based on the physical adsorption characteristics of inert gases such as nitrogen on the catalyst surface. By measuring the adsorption amount at different pressures, a specific theoretical model is used to calculate the specific surface area, pore volume, pore size distribution, and other information of the catalyst. As shown in Figure 1, the adsorption desorption experiment of the catalyst in a nitrogen environment can determine its specific surface area size and pore structure, and can clarify the particle size distribution. The rich pore structure and high specific surface area make it perform well in adsorption and catalytic reactions. BET analysis can accurately reveal these characteristics, providing a basis for optimizing the preparation and application of catalysts.
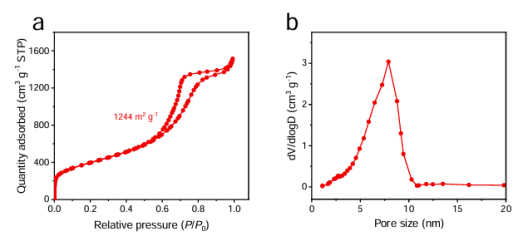
Picture 1:Nitrogen adsorption desorption curve and pore size distribution
structural analysis
1.X-ray diffraction (XRD)
XRD technology is like taking a 'molecular structure photo' of a catalyst. When X-rays are irradiated onto catalyst samples, diffraction phenomena occur, and catalysts with different crystal phases produce specific diffraction patterns. The crystal structure, phase composition, and grain size of the catalyst can be determined through analysis. For example, in Figure 2, XRD tests were conducted on three different powder catalysts, and the results showed that all three samples with different morphologies were highly matched with the standard card of Cu9S5 (JCPDS 47-1748).
The half peak width of Cu9S5 SNWs (001) crystal plane is significantly larger than that of the other two forms of samples. According to Scherrer's formula, the smaller the grain size, the larger the corresponding diffraction peak half peak width. On the contrary, the larger the particle size, the sharper the diffraction peak half width. Due to the sub nanometer scale (0.95 nm) size of the Cu9S5 SNWs sample and the fact that the sample exhibits a single-cell structure without a complete crystal plane, the half peak width is significantly larger, while the (001) half peak width of Cu9S5 SNWs is higher.
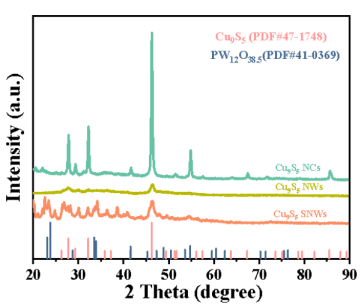
Picture 2: XRD pattern of Cu9S5 SNWs catalyst
2.Fourier transform infrared (FT-IR)
FT-IR is a spectroscopic analysis technique based on molecular vibration rotation energy level transitions. By irradiating the sample with infrared light generated by an interferometer, the absorption, transmission, or reflection signals of the sample to different wavelengths of infrared light are recorded. The interferogram is converted into an infrared spectrum through Fourier transform, reflecting the vibration characteristics of functional groups in the molecule. Its main function is to identify functional groups (such as hydroxyl, carbonyl, methyl, etc.) in molecules and infer the chemical structure of compounds through the position (wavenumber), intensity, and shape of characteristic peaks in the spectrum. It is the core means of structural analysis of organic compounds, polymer materials, and other materials.
In the FT-IR spectrum of Cu9S5 SNWs as shown in Figure 3, a significant red shift phenomenon was observed compared to Cu9S5 NWs, indicating the electronic interaction between Cu and S. The characteristic peaks of Cu9S5 NWs and Cu9S5 SNWs samples at 2916 cm-1 and 2846 cm-1 can be attributed to the stretching vibration mode of methylene (- CH2-) in dodecanethiol, while the characteristic peak at 1471 cm-1 corresponds to the bending vibration mode of C-H bond.
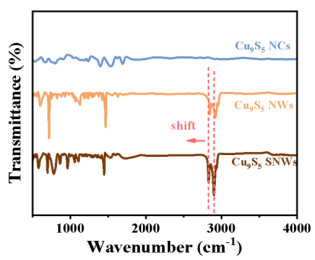
Picture 3. infrared spectrum
3. Raman characterization
Raman spectroscopy is based on the Raman scattering effect. By detecting the frequency difference (Raman shift) between the scattered light and the incident light generated by the inelastic collision of laser and molecules, the vibrational and rotational energy level characteristics of molecules can be obtained. The Raman shift is the "fingerprint" of the molecular structure, especially suitable for non-polar functional groups that are difficult to measure by infrared spectroscopy (such as carbon carbon double bonds and symmetrical functional groups), often complementary to infrared spectroscopy.
As shown in Figure 4, the Raman spectrum of V-RuO2 (V-doped RuO2) is consistent with that of RuO2, with no other unique peaks, excluding the generation of V2O5. V doping shifts the A1g mode of RuO2 to lower wavenumbers, indicating that the introduction of V significantly affects its lattice structure and chemical bonding environment (which may result in oxygen vacancies or local defects), thereby altering its electronic structure; The left shift of the A1g peak reflects the interaction between V atoms and the RuO2 lattice, indicating that V doping modulates the local symmetry and bond length characteristics of RuO2.

Picture 4: Raman spectra of V-RuO2.
Chemical composition analysis
XPS technology can deeply analyze the elemental composition, chemical states, and electronic structure of catalyst surfaces. When the catalyst surface is irradiated with X-rays, the electrons of the surface atoms are excited. By detecting the energy and quantity of these photoelectrons, we can determine the type and content of the element, as well as the chemical environment in which the element is located. For example, when studying supported metal catalysts, XPS can accurately determine the form of metal on the surface of the support, whether it is a metal element or a metal oxide, and the changes in its oxidation state. This is very important for understanding the activity and deactivation mechanism of the catalyst. As shown in Figure 5, XPS was used to demonstrate the composition and valence states of Ru, Co, and Ni elements. The XPS fine spectra of specific elements in the sample were used to determine the positive/negative shift of binding energy, indicating the existence of electronic interactions.

Picture 5:XPS fine spectra of Ru 3p, Co 2p, Ni 2p
microscopic techniques
1.Scanning Electron Microscope (SEM)
SEM scans the surface of the sample by emitting an electron beam, collecting secondary electrons or backscattered electrons for imaging, which can provide microscopic morphology information of the catalyst surface, with a resolution generally ranging from nanometers to micrometers. Through SEM images, the size, shape, and aggregation state of catalyst particles, as well as the surface texture and roughness, can be visually observed. When studying porous catalysts, SEM can clearly display the distribution of their pore structure, which is closely related to the mass transfer and reaction performance of the catalyst.
2.Transmission Electron Microscope (TEM)
TEM allows us to directly observe the microstructure of catalysts. It emits an electron beam through the sample and images the scattering after the interaction between electrons and the sample. By using TEM, we can clearly see the size, shape, and distribution of catalyst particles, as well as observe the lattice structure and defects inside the catalyst.
The basic characterization techniques of catalysts are powerful tools for gaining a deeper understanding of their physical, chemical, and structural properties. Through comprehensive application, the catalytic reaction mechanism can be revealed, providing a theoretical basis for the design and development of high-performance catalysts. With the advancement of technology, this technology continues to innovate and develop towards higher resolution, more accurate quantification, and better simulation of real reaction conditions.
SAT NANO is a professonal supplier of nano powder and micro powder in China, we can offer metal powder, alloy powder, carbide powder, oxide powder and so on, if you have any enquiry, please feel free to contact us at sales03@satnano.com