
Are you interested in learning how to analyze XRD patterns? Understanding the experimental conditions and identifying peak positions can provide essential information for interpreting XRD images correctly. In this article, we will guide you through the steps on how to analyze XRD patterns.
Determining Experimental Conditions
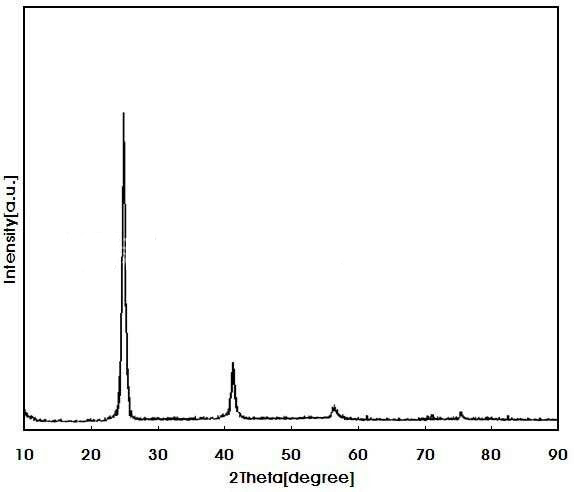
Before analyzing an XRD pattern, it's important to understand the experimental conditions. Knowing the X-ray source, scan range, and scan speed are necessary details to obtain accurate results. Typically, XRD images are represented with 2θ (angle) and intensity (count rate) as the X and Y-axis, respectively.
Identifying Peak Positions
Observing the sharp peaks on an XRD pattern is how we identify the crystal structure. Each peak corresponds to the spacing between planes of atoms in the crystal lattice. By comparing the peak position to standard crystal structure databases, we can determine the crystal structure type of the material.
Analyzing Peak Shape
By analyzing the shape of the peaks on an XRD pattern, we can determine the crystallinity of the sample. Amorphous samples have a broad peak without a fine structure, while crystalline materials have sharp peak features. The intensity of the strongest peak can be compared to that of a standard sample to determine the degree of crystallinity of the sample. Additionally, peak shape and symmetry can reflect information about the crystal structure and defects. For example, a single crystal will have sharp peaks, while polycrystalline materials will have broader peaks.
Determining Crystal Structure
By comparing the measured peak positions to standard crystal structure databases, the crystal structure type of the material can be determined. Additionally, measuring the relative intensity of the peaks can provide information on the orientation of the different crystal planes and the preferential growth direction of crystals.
Analyzing Impurities and Defects
XRD patterns can also be used to detect impurities and defects in materials. The presence of impurities can cause shifts in peak positions and additional peaks. By comparing the observed peak positions and intensities to reference data, we can identify the impurities and defects present in the material.
In conclusion, analyzing XRD patterns provides valuable insights into the crystal structure, the degree of crystallinity, and the presence of impurities and defects in materials. By following these steps, you can effectively analyze XRD patterns and obtain insightful information.
SAT NANO is one of the best supplier of nano powder in China, we can offer metal nanoparticle, carbide nanoparticle, oxide nanoparticle and alloy nanoparticle, if you have any enquiry, please feel free to contact us at sales03@satnano.com